In this guide
A percentage can look easier to compare than a raw count. It is only useful when the reader knows what the percentage is a share of. For a Phoenix municipal analyst, a denominator check is a practical defense against overinterpreting a dashboard or a public report. It is also a good peer-learning exercise because the arithmetic can be simple while the meaning is not.
Name the counted event and the eligible set
A rate needs a numerator and a denominator. “Completed requests” is not enough: completed out of which requests, received when, and under what rule? A measure might describe items received in a period or items closed during it. Those populations need not be identical.
Phoenix's data-and-evidence page and official Open Data route provide public context for exploring City information. This article uses invented numbers rather than asserting a result from a live dashboard. The exercise is about reading definitions, not grading a department's performance.
Try the unequal-population example
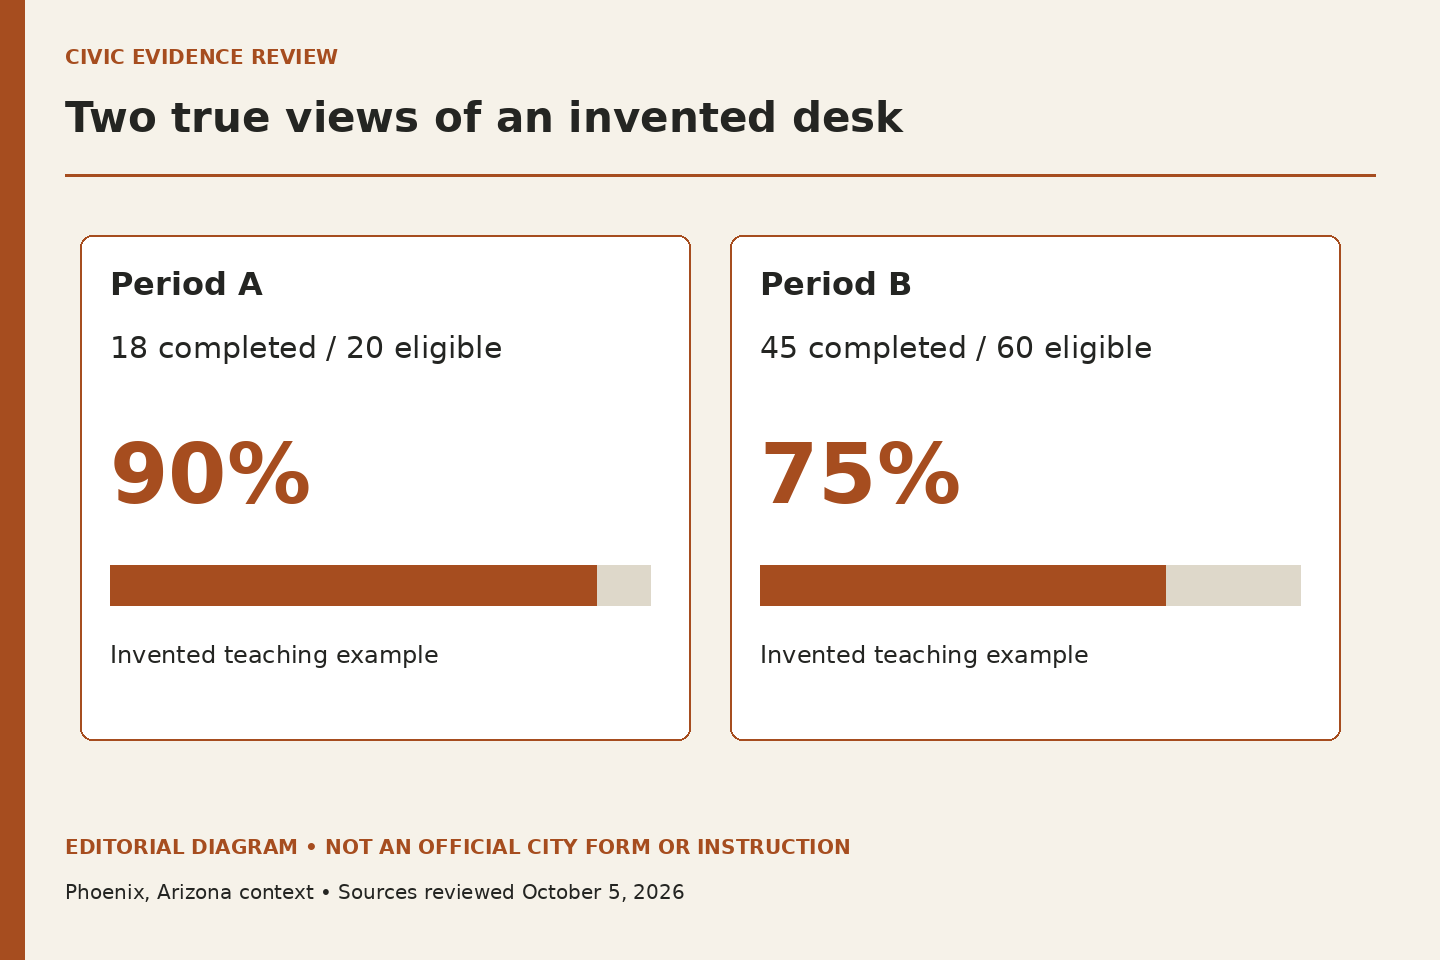
Suppose a fictional desk completes 18 of 20 eligible items in one period and 45 of 60 in another. The completion shares are 90 percent and 75 percent. The second period has more completed items but a lower share. Neither statement is false; they answer different questions.
Before explaining the difference, ask whether the eligible sets and completion rule are comparable. A change in case mix, counting practice or reporting period could matter. The example does not prove lower effort or poorer service. It shows why a rate should travel with the underlying counts and definition.
Watch for small denominators
A one-item change has a large percentage effect when the denominator is small. That can make a chart look dramatic without establishing a stable trend. Include the counts where appropriate and avoid language suggesting precision that the data cannot support.
For workplace use, do not import private case-level data into a personal calculator or this publication. Practice with public aggregates or invented examples. If a small group could expose personal information, follow the applicable data-governance and disclosure process before sharing any table.
Make the comparison sentence complete
A clear sentence names the event, eligible population, period and any known definition change. If one of those is missing, say what cannot yet be concluded. A reviewer should be able to see whether the comparison is like for like without opening several hidden tabs.
The final question is not “Which rate is bigger?” but “What does this difference support us in saying?” Sometimes it supports a narrow descriptive statement. Sometimes it supports only a request for clarification. Both are better than a confident explanation built on an unknown denominator.
Sources and limits
Official public sources checked October 5, 2026. Examples and exercises are original editorial illustrations, not City records or instructions.
- Improving Phoenix with Data and Evidence
Published data and performance initiatives. Exercise datasets are explicitly hypothetical, not Phoenix performance claims.
- Phoenix Facts and Statistics
Official route to the Open Data portal. Headline city counts are not copied or treated as a consistent dataset.